Geotechnical News • June 2016
35
THE GROUT LINE
of weeks of laboratory testing, and
full-scale mix testing using the same
mixer which would eventually be
used to the main works, two grout mix
designs were eventually selected.
a. for the primary holes, a slag-based
cement using 32 µ material, with
the addition of a super-plasticiser,
and with a gelling agent to assist in
retaining grout in situ despite the
significant hydraulic head across
the grout curtain. In addition, the
mix was tested with an accelerator
in case significant voids or fissures
were encountered which could
lead to the grout being washed
away and into the river down-
stream of the dam.
b. For the secondary and tertiary
holes, a slag based cement using
12 µ material, with the addition
of a super-plasticiser and gelling
agent
In order to avoid premature blockage
of the extremely fine fissures, it was
necessary that the rheological prop-
erties of the grout remain constant,
well controlled, and well understood
throughout the injection, and consider-
able care was taken in ensuring that
the gel times of the two mixes would
allow injection of the full target vol-
ume when using the GIN technique. A
minimum gel time of not less than 2.5
hours was established.
The GIN value was carefully selected
to reflect the average absorption per
linear metre experience during the
2003 works, the designers’ require-
Hydraulic Testing
Preliminary results
Borehole VH04
Interval
Test
Event
P
i
P
END ∆
P
∆
P Flow
Lugeon h "s"
(2)
T
K
T
K
Top Bottom Length
Rate
Hl
Steady
Units
[m]
[m]
[m]
[kPa]
[kPa]
[kPa]
[kPa] [ml/min] [sec]
[sec]
[l/m/min] [mbgl]
m2/s
m/s
m2/s
m/s
VH04‐i2
37.80
49.00
11.20 Hl
403.63 522.44
118.81 1.19
1.126 1800 1800
0.8
5.00 1.70E‐06 1.52E‐07
1.43E‐06
1.28E‐07
VH04‐i3
32.80
37.81
5.01 Hl
355.34 632.51
277.17
404 1241 1000
0.29 5.02 1.86E‐07 3.71E‐08
1.78E‐07
3.55E‐08
VH04‐i4
27.80
32.81
5.01 Hl
250.01 636.15
386.14 3.86
59
916 600
0.03 10.86 1.31E‐08 2.62E‐09
***
***
VH04‐i5
25.20
30.21
5.01 Hl
151.06 561.44
410.38 4.10
49 1018 200
0.02 18.39 7.70E‐09 1.54E‐09
***
***
VH04‐i6
20.20
25.21
5.01 Hl
157.97 498.29
340.32 3.40
44 1073 500
0.03 12.79 1.05E‐08 2.10E‐09
***
***
VH04‐i7
16.00
21.01
5.01 Hl
183.41 558.84
375.43 3.75
1127 1127 700
0.13 6.08 7.04E‐08 1.41E‐08
1.40E‐07
2.79E‐08
(1)
Depth along borehole axia
(2)
Head in vertical meters below ground level
P
i
Initial pressure, or best estimate of "static" pressure
[l / min]
2.00E‐06
P
END
Pressure at end of test
[m]
0.048
h s
"static" head, metres below ground level
Sensor P2 above top interval
[m]
1.66
P1
Pressure below bottom packer
P. atm (P2 prior to installation)
[kPa]
105.06
P3
Pressure above top packer
Inclination ( from Horizontal )
[
0
]
78.7
SL
Straight‐line
SSA
Steady‐state approximation
straiht line fit on middle time data, SSA on late
time data, positive skin effects SSA results
Assumed spez. Storativity
Well radius
Straight‐line analysis
Steady‐state
HI: very low transmissivity zone, no straight
line fit possible, SSA on middle to late time data
HI: very low transmissivity zone, no straight
line fit possible, SSA on late time data
Upper packer is inflated in the concrete, HI:
Single packer test, bottom of interval is
uncertain, the borehole was dipped before
the test to 40 mbgl, here the interval is
assumed to be 11.2m. Hl : straight line fit on
late time data, SSA on late time data
Hl: little bypass P1(14.8 kPa), straight line fit
on middle time data, SSA on late time data
HI: very low transmissivity zone, no straight
line fit possible, SSA on late time data
Depth
(1)
Duration
Remarks
approximation
(transient)
(SSA)
(SLA)
Table 1: Preliminary hydraulic testing results from validation boreholes
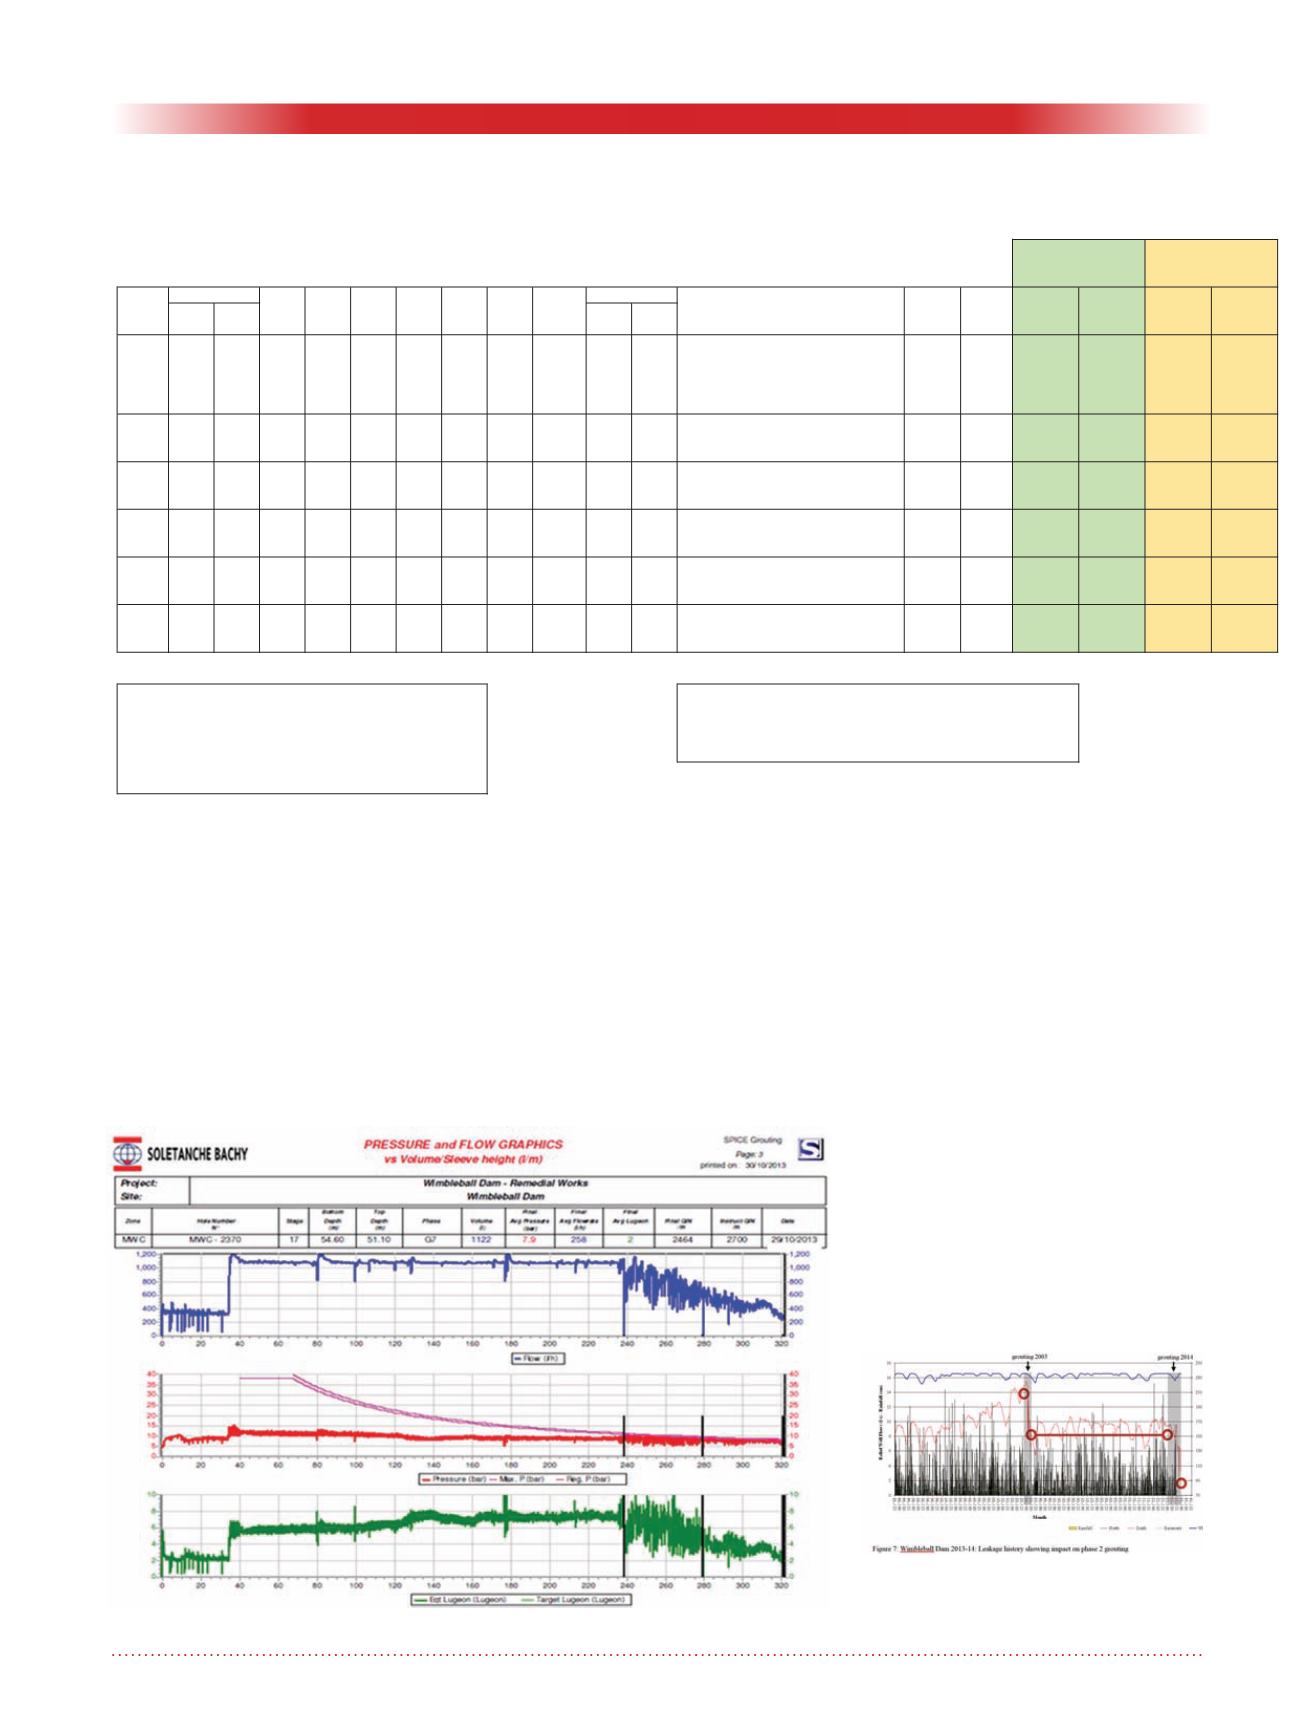
Figure 6. Pressure and flow graphics.
Figure 7. Wimbleball Dam 2013-14:
Leakage history showing impact on
phase 2 grouting.


