Basic HTML Version


32
Geotechnical News • December 2013
www.geotechnicalnews.com
GEOTECHNICAL INSTRUMENTATION NEWS
pile during driving and static loading
testing. The modular nature of the RTP
system and its integration with the
Becker system enables testing down to
30 m to be completed in one day with
limited time for pile setup.
Example results
A field test was carried out to evalu-
ate the initial design and performance
of the RTP sections. The field testing
was performed at the Caltrans I-880
interchange site in Oakland, CA where
the soil profile varies from soft clay to
very dense sand. Figure 5 summarizes
the soil variation with depth along
with CPT tip resistance, CPT friction
ratio, SPT N values, and RTP blow
count values and bounce chamber
pressure. As evident, the RTP hammer
blows correlate well with SPT and
CPT data.
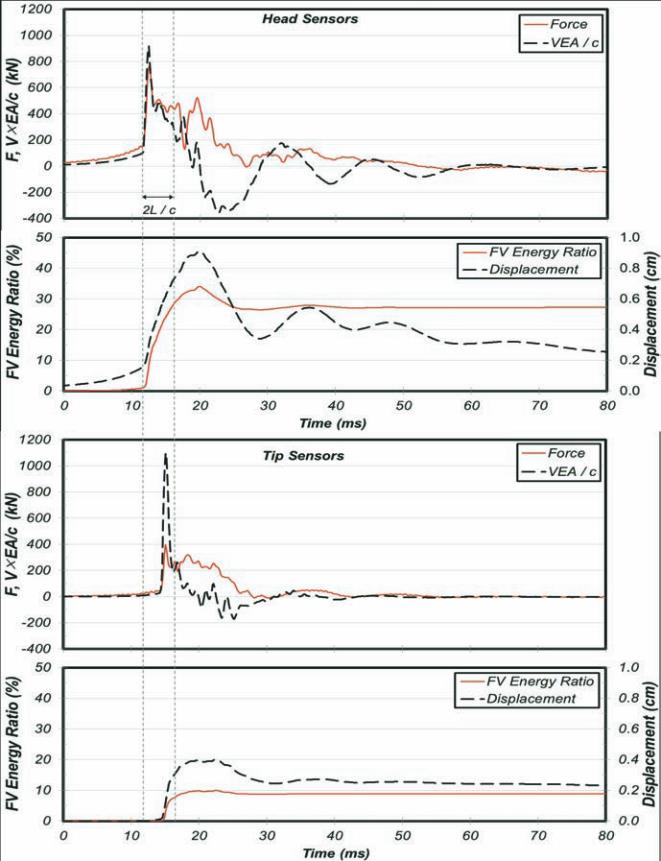
RTP recording during dynamic driv-
ing provide insight into installation
conditions, including forces, accelera-
tions, energy, and displacements at
all locations where the RTP modules
are located. An example output from
instrumented section position behind
the tip and at the head of the drill
string during hard driving through
dense sand at a depth of 9.4 m is
presented in Figure 6. The corre-
sponding measured RTP blow counts
were 89 for 0.3 m (1 ft) penetration.
The force and velocity (multiplied
by section impedance), as well as the
displacement and energy time histories
measured at head and tip sections is
shown. The force-velocity propor-
tionality is confirmed at the head
section during the first
1L/c
interval
with small deviations due to shaft
resistance. The wave arrives at the tip
section with an approximate
L/c
delay.
As expected in hard driving condi-
tions, a large negative velocity pulse
returns at the head. There is a signifi-
cant difference between the maximum
displacement recorded and the residual
displacement, showing the elastic
compression of the pile during the
impact. The maximum velocities mea-
sured at the head and tip are similar,
while about 50% of the recorded force
at the head arrives at the tip. Only a
fraction of the energy measured at the
head arrives at the tip. The residual
displacements measured in the head
and tip sections are close, providing
more confidence in the accuracy of the
measurements.
RTP tension load tests, with or without
pile setup, provide insight into both
overall capacity and the distribution
of load along the pile length. Results
from a tension load test performed
after installation to 12.8 m and after
4 hours of pile setup are presented in
Figure 7. The upper (light blue) curve
corresponds to measurements above
ground while the lower (dark blue)
curve corresponds to axial force in
the pile at 10 m depth. The displace-
ment required to reach full pullout
capacity occurred before 10 mm of
displacement. The total tensile capac-
ity of nearly 600 kN was observed
to increase by 100 kN relative to an
adjacent pile load test where no setup
time occurred (not presented). About
50% of the tensile load was mobilized
above 10 m depth, primarily due to the
high shaft friction in the upper dense
Figure 6. Representative measurements obtained during dynamic driving.