42
Geotechnical News • March 2016
THE GROUT LINE
and the drainage of the embankment
through the up-stream face after the
reservoir draw-down.
In order to limit potential damage
to the core and to avoid the risk of
heave, the injections commenced
with a relatively modest GIN value
of 1,000. The early section of the
works was phased so that the grouting
engineer could very quickly observe
the effectiveness of the ground treat-
ment over the primary and secondary
phases for a limited section of both
the upstream and downstream grout
curtain. The reduction ratio achieved
for the grout volumes injected in the
four successive phases was lower
than was anticipated, and the GIN
value was therefore increased to 1,200
to allow slightly greater pressures
and greater maximum volumes to
be applied for the remainder of the
works, whilst retaining the same target
volume per linear metre, and the same
limiting maximum pressure. A single
GIN value was selected for the entire
works.
At Carno, the GIN system was applied
with particular care, partly because of
the reduced confinement arising from
the reservoir draw-down, and partly
to ensure that the results at the end of
the secondary phase met the specified
requirements, with no requirement
for a tertiary phase. The software
displayed real-time plots of basic
injection parameters, together with an
additional completion criterion, - the
‘Equivalent Lugeon’ value. This value
combined the volume, pressure, and
time data for the injection in progress,
and calculated an Equivalent Lugeon
value, by taking into consideration
the relative viscosity of the grout
mix to that of water. This function
was clearly not a true Lugeon value,
but a close estimation for fluidified
and stable grout, which allowed the
progressive evolution of the effective
Lugeon value, and hence the progres-
sive reduction in transmissivity of the
rock, to be observed in real-time as the
injection progresses, similar to con-
tinuous water test, but with grout.
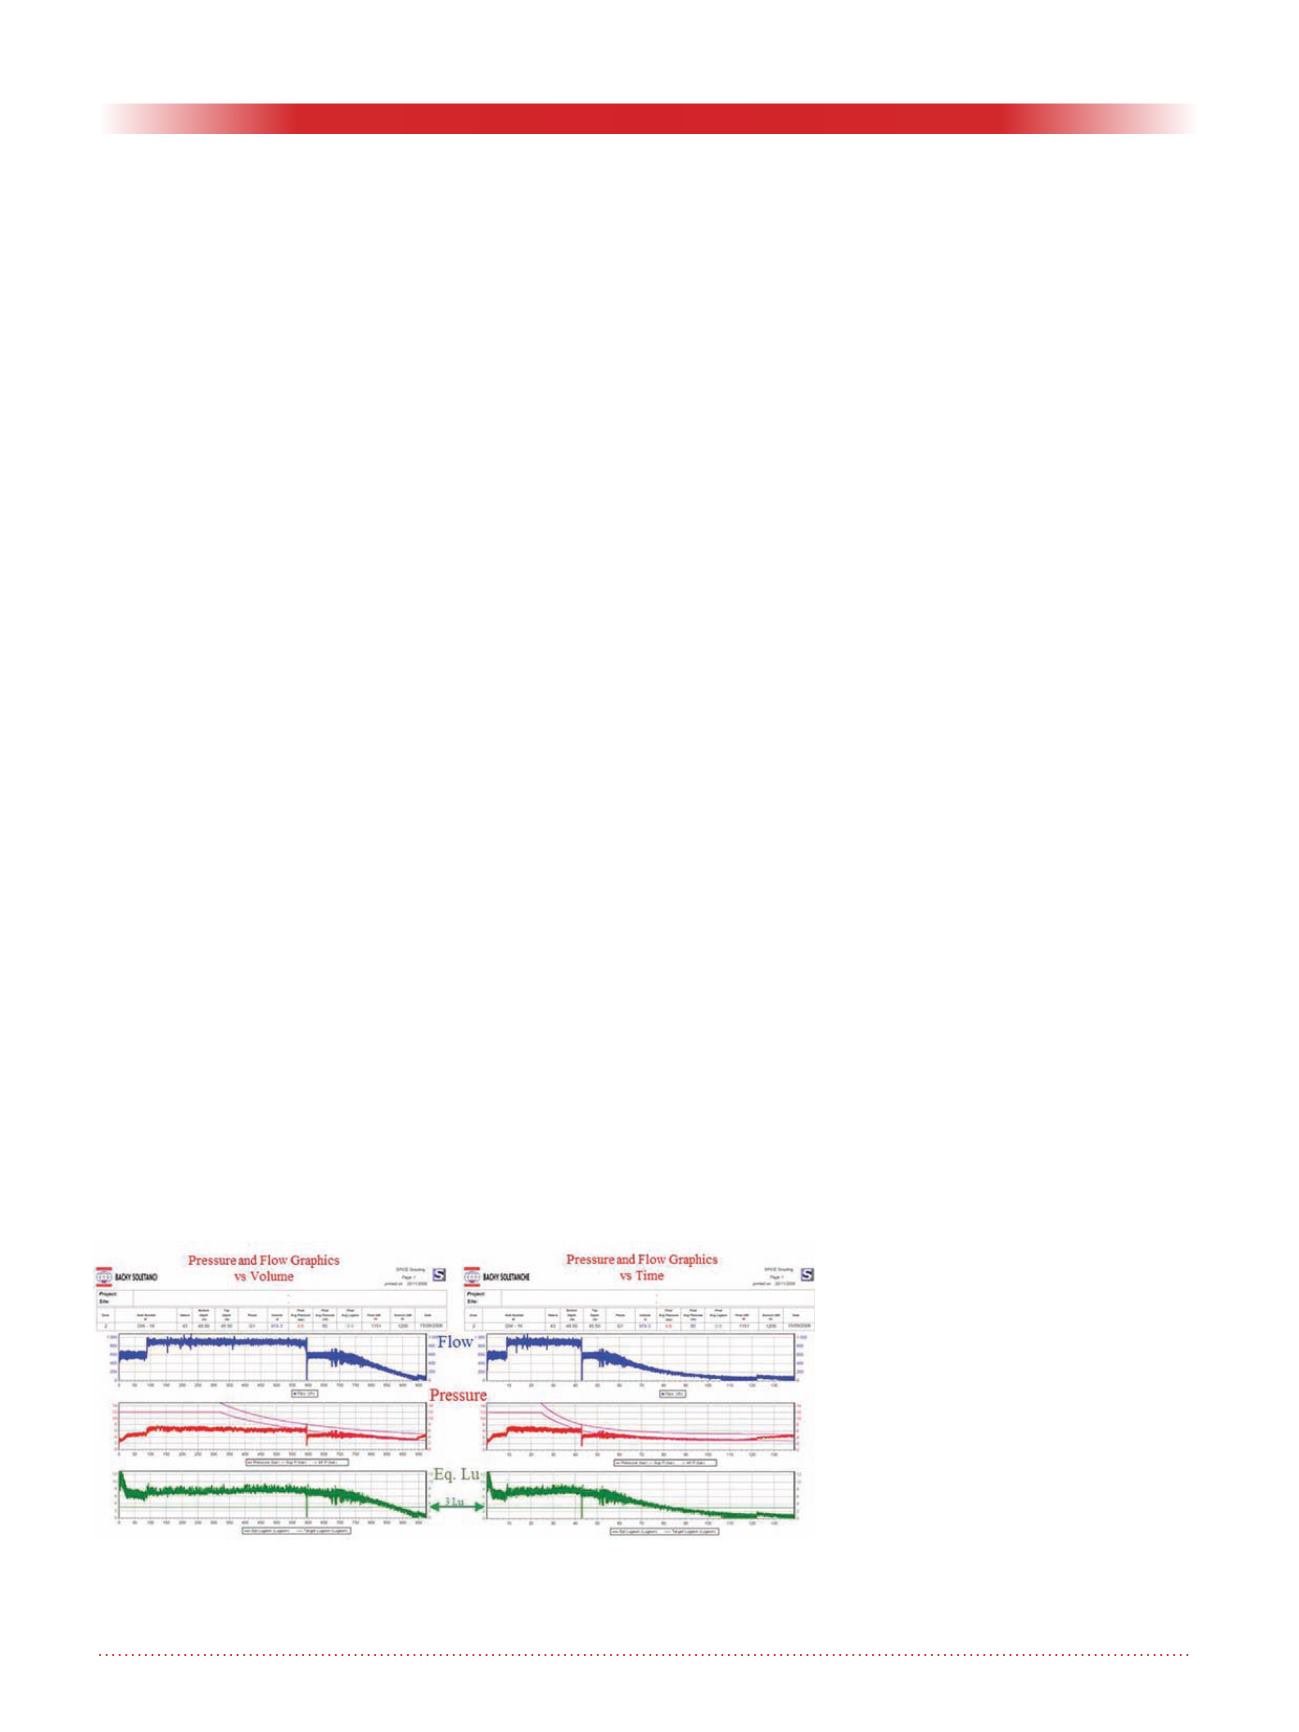
In the typical example illustrated in
Figure 2, it can be observed that at
the end of the injection the pressure
increases and flow rate reduces - clear
evidence that the rock is “tightening-
up’; but also that the injection has
continued until the Equivalent Lugeon
value has fallen below the speci-
fied maximum allowable value of 3
Lugeons. However, if the same graph-
ics are plotted against a timescale,
Figure 2 (right) it can be seen how
much effort was taken to achieve the
best possible’ refusal’, by continuing
the injection well beyond the point
where the specified 3 Lugeon criteria
had been met. It can be observed that
in this example the grouting continued
for half an hour after the specified
threshold, so that the refusal could be
demonstrated over the last 30 minutes
of injection.
Working in this conservative manner
achieved excellent results and ensured
for the client that there was no require-
ment for a further tertiary phase of
treatment, which would certainly have
added considerably to the cost and
duration of the works.
Grout curtain design
The methodology and scope of the
grouting works evolved throughout
the duration of the project in response
to ground conditions, and this evolu-
tion was documented and controlled
through the issue of detailed method
statements and technical memoranda.
The basic elements of the drilling and
grouting design processes included:
• Preparation of a 3D design model
of borehole geometry for works
phasing, management, control,
planning, and reporting using
CASTAUR programme
• Generation of instructions for
the drill crews using CASTAUR
programme
• Accurate setting out of drill hole
locations
• Drilling of boreholes to rock head
and installation of guide /liner
pipes and /or TaM pipes
• Survey of as built alignment of drill
holes using Boretrack /Maxibor
• Revision of the 3D design model
for as-built locations
• Design of injection parameters for
grouting, including GIN mode
• Generation of electronic grouting
and water testing instructions us-
ing SPHINX, including selection
of GIN value
• Sequencing of grouting pro-
grammes
• Drilling of preliminary injection
stages and water testing
• Review of injection parameters and
mixes using SPHINX and SCAN
3-D
• Drilling and injection in phases as
detailed in sections under SPICE
pump regulation
Figure 2. Injection rate (blue), Pressure (red), and Equiv. Lugeon (green)
values plotted against the injected volume (left). Injection rate, Pressure, and
Equiv. Lugeon values plotted against the injection duration (right).


